Fossil Pollen Diagram
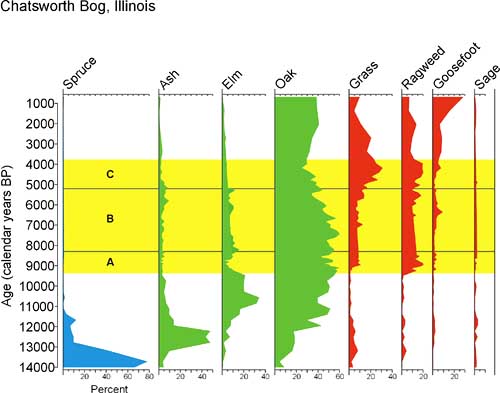 |
| King, 1981 Diagram made from data archived in the North American Pollen Database |
The pollen diagram shows that spruce forest existed at the beginning of the record 14,000 years ago. By 13,000 years ago ash had become very abundant replacing spruce, and by 12,000 years ago elm and oak were rapidly increasing. The high abundance of ash and elm between from 13,000 to nearly 9000 years ago indicates very wet conditions because today these trees normally occur on poorly drained soils such as those on floodplains. About 9000 years ago, elm decreased while grass and ragweed increased, indicating the development of prairie in the region. However, abundant oak pollen indicates that oak woodland or savanna was widespread. By 8000 years ago, elm had recovered and remained fairly abundant until about 5000 years ago, when it decreased again. The maximum development of prairie was after about 5000 years ago. Other sites from the Prairie Peninsula, especially Roberts Creek in northeast Iowa (Baker et al. 1996), show that the driest period was from about 5000-6000 years ago to about 3500 years ago. After about 3500 years ago, the climate became somewhat wetter, but prairie persisted, due in large part to the annual prairie fires, which inhibited tree invasion. For most of the past 14,000 years, Chatsworth was a lake. By about 3000 years ago, sediment had almost completely filled the basin, and it changed from a lake to a fen, which deposited peat. Local pollen from the fen plants somewhat complicate the interpretation of the pollen diagram after this time.