Interactive Graph
Oral history audio and video clips can be used to illustrate documents such as statistical graphs and seconday source narratives. This example is a graph showing the reduction in numbers and increase in size of Illinois farms from 1880 to the present.
Hover your mouse over each image to read the transcript of a clip. Click on each image to see a movie of audio and video clips and images reflecting information in the graph. Scroll down for Topics 2, 3, and 4, which expand when you click on the + sign to the far right of the title.

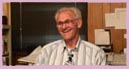
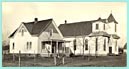
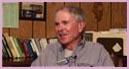
 “He was in Maldaners crying one day, practically crying. I said, “Whats the matter?” He said, “Im going to lose my farm.” And I said, “Why?” “Well” he said, “Ive lived all my life at my fathers, but he never deeded the house to me. I just lived in it and owns this other farm. And now, he says, Hes dead, theyre dead, all of ’em. We got to divide it up and havent any money to pay for where I live and cant sell what I own.” Right at the bottom of the depression. I thought about it, and I said, “What do you want for it?” And he told me. I said, “Ill buy it.” And he says,“Now Evan, seriously, dont joke about this.” And I said, “No, Ive hunted over every inch of it. There isnt anybody who knows it like I do. Ill buy it
” So we went over to Barber and Barbers office and closed up the deal. I went home that night and told Edna I bought a farm.” — Evans Cantrall, b. 1884
“He was in Maldaners crying one day, practically crying. I said, “Whats the matter?” He said, “Im going to lose my farm.” And I said, “Why?” “Well” he said, “Ive lived all my life at my fathers, but he never deeded the house to me. I just lived in it and owns this other farm. And now, he says, Hes dead, theyre dead, all of ’em. We got to divide it up and havent any money to pay for where I live and cant sell what I own.” Right at the bottom of the depression. I thought about it, and I said, “What do you want for it?” And he told me. I said, “Ill buy it.” And he says,“Now Evan, seriously, dont joke about this.” And I said, “No, Ive hunted over every inch of it. There isnt anybody who knows it like I do. Ill buy it
” So we went over to Barber and Barbers office and closed up the deal. I went home that night and told Edna I bought a farm.” — Evans Cantrall, b. 1884
| Topic 2: Mechanization |
[-] |
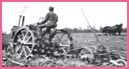
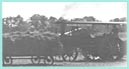
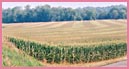
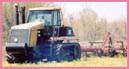
 “... I remember laying on the alfalfa bags in front of the wagon and he let me drive the horses, but I wasnt actually driving them because they knew where to go anyway and they always turned at the right end...Yesterday my grandson rode with me planting corn; hes three years old, same age I was, and we have auto steer, RTK auto steer, one inch accuracy, and he thought he was driving.... what the horses were doing automatically, sixty, seventy, sixty five years ago, now were doing by satellites” — Jim Kinsella, b. 1940
| Topic 3: Cultural Impacts |
[-] |
 Q:
Now, when did the talk of consolidation begin? When did people begin considering that?
Q:
Now, when did the talk of consolidation begin? When did people begin considering that?
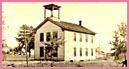
A: When they first began considering it, I didn't like the idea at all, because I was afraid it would take us in, and I loved West Point! Let's see, we went in I believe it was 1948 that we met in the town and I think they began talking about it in 1946 anyway. I know over at Western one summer, Dr. Bailey talked about the wonderful buses and all that, and I wanted to stop my ears. I didn't want to hear it, about our children being taken into town, you know. I had to listen , but I wanted to tell him how wonderful a school we had... — Ruth Brassel, b. 1896
 Q: As the farms were growing earlier you said there were equipment dealers in every town. Did this change?
A: Well, it did change to a certain extent, because there wasnt a market for all the dealers cause after the farmers got into more elaborate mechanization with the larger tractors, with the combines, with the method of fixing the soil so he could plant the crops. There were less farmers to buy the equipment. So, if theres less farmers, theres less potential for the machinery-man to sell machinery. So some of them dropped out. But some of the big ones still stayed in, like International Harvester, John Deere, and Case, and Massey-Harris. Then, in the last few years theyve narrowed down too, so there arent as many. — Carl Boekenhauer, b. 1908
| Topic 4: Diversification |
[-] |
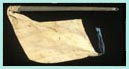
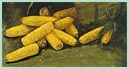
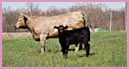
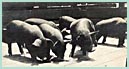
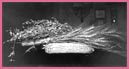 “Everyone of em raised corn, beans, and, oats, and hay.... Almost every farm had cattle, had hogs, always had chickens, and probably your dairy cow. There was a few of 'em in dairy,... But I think it was eight or ten years ago we happened to be sitting down with a bunch of farmers... and he said you can go from county line to county line now, on Route 38 and you can't find a single farm on there that has livestock. And if you look at the crops the crops are corn and soybeans, that's just about it.” — Bill Clausen, b. 1926